
If I want to be called a data scientist I need to know how to easily show my numbers. This means python, but not only, also an easy way to export in an app your results. I found out that you can achieve most of it with a docker. As usual, I will assume you have a healthy docker environmet. We will follow this github page but you can install it for real if you follow this guide. Actually I would keep both in mind to understand the whole thing. Briefly then:
- Clone the repo.
git clone https://github.com/yaojiach/docker-dash.git - Cd to the folder and build the docker.
docker build -f Dockerfile.dev -t docker-dash-example-dev . - Run it.
docker run -d -p 8050:8050 -v "$(pwd)"/app:/app --rm docker-dash-example-dev
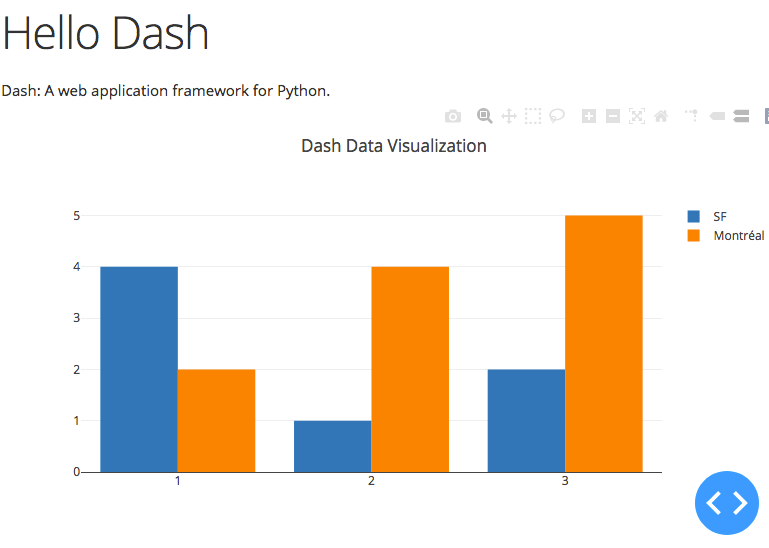
That’s it. If you go now to http://localhost:8050 you should get a plot similar to the one above. Obviously you don’t want to plot the fruits consumed per american city or whatever that is. I’m pretty sure I don’t need to tell you how to modify that, but there’s that app folder on the thing you donwloaded on step 1. Open app.py and have a look. There you have it! Just modify it according to your needs… 😉…

Pingback: A python dash web multiplot example reading CSV data | Bits and Dragons